As technological advancements allow business entities, both public and private, to capture, manage and process information in ever-expanding ways, those endeavors enter the realm of “big data.” Big data is widely described in terms of the three V’s: 1) volume, 2) velocity, and 3) variety of information.
Data is, of course, the lifeblood of our industry, so imagining the possible underwriting applications of this movement is exciting. This article describes the use of big data in developing a credit-based model in the United States. There are many differences between the U.S. and Europe, but this summary presents an interesting example of how big data can be used and correlated with insurance experience.
Credit scoring has long been used to simplify the process of buying a car, insuring a house, or applying for a credit card. In 2014, RGA began working with TransUnion, one of the largest credit bureaus in the United States, to explore ways in which the big data from TransUnion could be used to develop a study of mortality that would reveal possible applications within the life insurance industry.
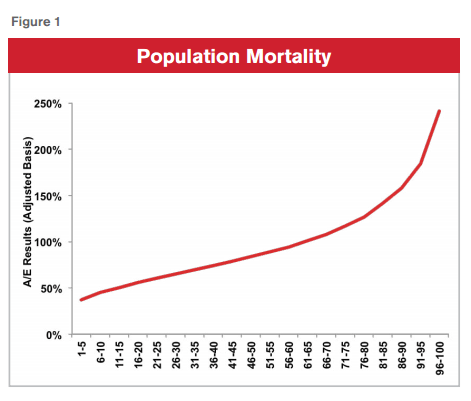
As can be seen in Figure 1, we scored the individual lives using our credit-based scoring system to better understand and quantify the mortality segmentation, that is, the amount by which actual-to-expected (A/E) mortality could differ among categories. The overall mortality of those with the lowest score (best 5% of the population) was five times better than that of the worst 5%. We also analyzed additional splits by age, calendar year and gender, among others.
Application to Life Insurance
Additional studies within insured blocks of business were first presented to the industry in the spring of 2015. Completing a retrospective analysis and understanding the impacts on insured lives were critical in determining the true value of credit-based scoring to the life insurance industry. A few of the key takeaways were:
- Significant mortality segmentation still existed within fully underwritten and simplified-issue markets.
- Use of our credit-based score revealed significant lapse segmentation.
I. Mortality segmentation
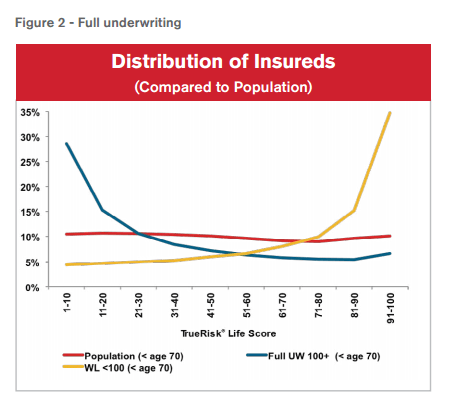
The distribution of our credit-based scoring was set up so that each score represents 1% of population. However, it is not surprising that this distribution would change within an insured environment based on product and underwriting method. As is illustrated in Figure 2, population exposure (red line) is flat due to how the model was constructed. However, one insurer’s book of business clearly shows that its fully underwritten business (blue line) is heavily skewed towards the better scores. Conversely, its small face amount whole life simplified-issue products (yellow line) were equally skewed toward the higher scores.
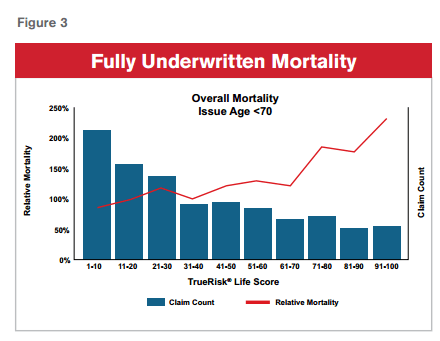
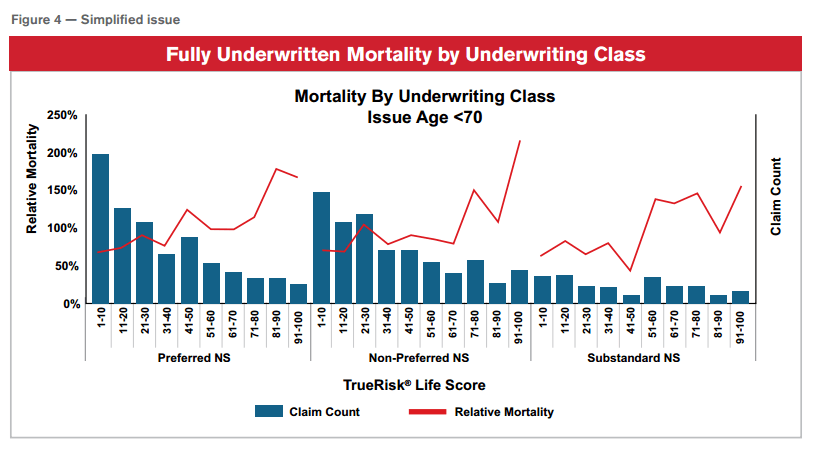
When we focus just on the fully underwritten business, we continue to see significant segmentation by our score (Figure 3). We observed mortality rates 2.6 times higher in the 91-100 score versus the 1-10 score. Even more impressive is our credit-based scoring system's ability to segment within a risk class (Figure 4). After all application questions, smoking status, blood tests, prescription drug histories, motor vehicle reports and other traditional underwriting evidence (such as gender in the U.S.) have been incorporated and individuals have been placed into specific underwriting cohorts, the mortality in the 91-100 segment is still over two times higher than the 1-10 segment.
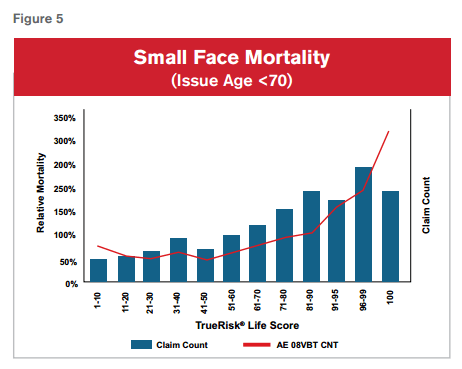
Within the “small face amount, simplified-issue” market, we saw even more mortality predictive value from our credit-based scoring system. This is not surprising due to the limited underwriting evidence currently gathered and the potential for anti-selection. We see six times higher mortality at the worst scores than the best scores within this type of business (Figure 5). With this block of business, over 10% of claims come from a score of 100, which represents the worst 1% of population relative to the score.
'
II. Lapses
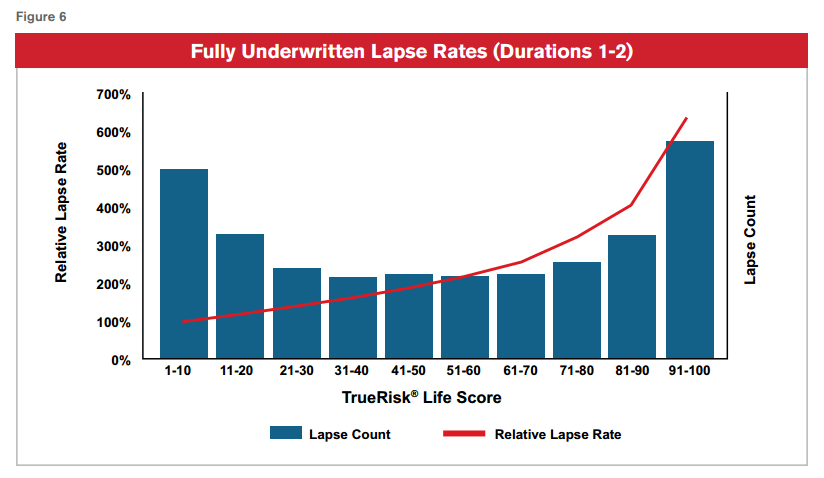
In addition to mortality segmentation, the TLR model also demonstrated its predictive value with regard to predicting lapses within fully underwritten business. Figure 6 illustrates the difference in lapse rates between the 1-10 group and the 91-100 group for the first two durations. We found that over six times higher annual lapse rates occur in the 91-100 group than in the 1-10 segment. In addition, we saw significant value in predicting lapses within a simplified-issue environment.
III. Business Applications
The most common applications for our credit-based scoring system include dynamic underwriting (underwriting triage), risk segmentation within a fully underwritten or simplified issue environment, batch segmentation for preapprovals or lead generation, cross-sell or upsell, and in-force management. Many unique and individualized approaches continue to be developed as credit becomes more widely discussed in the life market.
Parting Thoughts for EMEA
Fifteen years after the UK market first started using external data to refine the pricing of annuities at a postcode level, this exercise demonstrates how opportunities to apply big data in insurance have evolved. The approach resolves mortality prediction to the individual level using data that can be reviewed and challenged by the consumer, overcoming many of the concerns around using less granular or less substantiated data sources.
There are many differences in regulation, data ecosystems and societal views on appropriate rating approaches for insurance pricing between the U.S. and European states. While these differences may limit the extent to which a solution such as this is applicable in Europe, we believe this example illustrates the dramatic impact data can have on the life insurance market. As European insurers identify new markets and new ways of reaching potential customers, it is intriguing to know that our risk management capabilities are also reaching new levels.


